
System and network administrators often use Ethernet packet capture tools such as tcpdump [McCa97] and ethereal [Ether00] to debug network applications by. In some cases, a view of all traffic on a circuit is required to determine why applications are running slowly, or why the circuit is running at a high utilization. When the circuit in question is a WAN (Wide Area Network) point-to-point circuit (such as a T-1), or a Frame Relay network access line, there may not be a point where all of the packets can be observed on an Ethernet segment.
In this article we describe a system to record and analyze ``raw'' Frame Relay and point-to-point T-1 packets. The data are captured by ``eavesdropping'' on the HDLC transmit and receive lines between the router and CSU/DSU. Analysis of the data provides circuit and application utilization information on a one-second or shorter time scale. Routine and custom reports are accessible through Web interfaces to provide easy access by our global systems and network staff. The packet data can also be used to debug applications in the same way as conventional packet capture systems.
Frame Relay networks provide organizations with a flexible and economical method of interconnecting sites over a wide range of distances. A major source of the flexibility comes from the ability to connect many circuits over a single access line, such as a T-1 (1.5 Mbps) or E-1 (2Mbps, used in Europe). Each circuit, called a PVC (Permanent Virtual Circuit), has a guaranteed bandwidth, known as CIR (Committed Information Rate). Most Frame Relay carriers allow PVCs to ``burst above CIR'', possibly to the full bandwidth of the access line. The sum of the instantaneous bandwidth for all PVCs can not, of course, exceed the bandwidth of the access line. This leads to interesting traffic management questions.
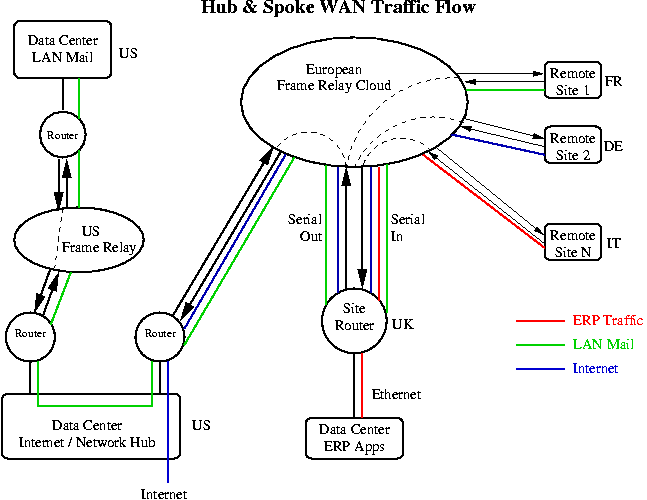
Complex Frame Relay networks are often laid out in a ``hub and spoke'' arrangement. Multiple hubs may connect subsidiary offices in a geographical area as shown in Figure 1. The hubs are then joined together, usually with higher bandwidth interconnections.
While debugging Frame Relay network problems, for both bandwidth management and application issues, we have used tcpdump to record packets at the Ethernet interface of routers. We often wished, however, that we could see exactly what data were flowing in and out of the T-1/E-1 serial access lines. This was especially true at Frame Relay hub sites where many packets pass through the router, but never appear on the Ethernet side because they are destined for another site on our network. In addition, useful Frame Relay header information is lost once the frames are converted to Ethernet packets.
Figure 1 provides an illustration of the problem. Of the three types of traffic shown, only the ERP (Enterprise Resource Planning) traffic enters the ``UK Data Center''. Packets for the other two applications, LAN mail and Internet, do not appear on the Ethernet segment but they can consume a large fraction of the bandwidth available on the serial access lines at this ``hub site''.
As we did more application debugging and traffic analysis it became clear that we needed a system to record raw frames outside the router, directly from the communications lines. Then we could examine any of the Frame Relay header information and as much of the data, including IP header and payload, as we cared to record.
Commercial systems were reviewed but none were found that met the requirement to record raw Frame Relay packets for more than a few minutes. Our company already used two of the more popular brands of ``WAN Probes'', but they are mostly useful for real-time diagnostics, and RMON (Remote Network Monitoring Management Information Base) type historical data. We considered using Network Flight Recorder [Ranu97], but it does not record data from WAN communications lines.
While most routers count the Frame Relay congestion notification bits (FECN and BECN, Forward and Backward Explicit Congestion Notification) in the header, they do not count discard eligible (DE) bits. The five-minute counts of FECNs and BECNs that we record via SNMP do not provide any method to assign the occurrence to a particular second, or to particular packets. Debugging an application / network interaction problem without the raw packet data is very difficult.
In this paper we will first review the hardware requirements and packet acquisition software. Then the traffic analysis software will be discussed, followed by real-world analysis examples including ``Congestion and Circuit Capacity Planning'', ``Using the Raw Packet Data'', and ``Application Profiling''. Two short sections describe the extension of the system for T-1 point-to-point circuits, and using tcpdump to perform similar analysis when the packets of interest are available on a LAN. We will close with some ideas for future applications.
The system is built on a low cost desktop platform running RedHat Linux (version 5.2 or 6.x). The heart of the hardware is one or more communications boards from sangoma.com, previously known as Sangoma Technologies Inc., (Markham, Ontario, Canada). The first few monitors we built used two Sangoma WANPIPE S508 ISA cards, but we are now using a single Sangoma WANPIPE S5142 PCI card that can handle four communications lines at up to 4Mbps in ``listen-only'' mode.
Acquiring the bi-directional data requires the use of two receive lines and the associated clock signals on the Sangoma cards. The transmit lines of the card are not connected. While we have successfully connected to T-1/E-1 lines using short cables directly attached to the communications lines, the use of an active ``Multi-Interface Tap'' is recommended. These taps present a high-impedance to the signal lines and allow a long cable to be safely used between the tap and the computer. The cost for a system to monitor a single T-1/E-1, including PC, communications board, and WAN tap is about US$2000. A second T-1/E-1 can be monitored on the same PC for an additional US$800.
The basic model for the system is to record packets in both directions (in-bound and out-bound) for fifteen-minute periods. At the end of each period the packet files are closed and a new pair of acquisition processes are started. Then a summary program processes the data from the previous period.
This model provides considerable simplification at the cost of only about a fifteen-minute delay compared to a real time system. It also allows convenient packaging of the summary results and a method to locate raw packet data when deeper analysis is needed. The hardware requirements are lower for this post-process model; all that is necessary is for the summarization process to complete in less than fifteen minutes while handling the input streams without packet loss.
The software consists of drivers provided by Sangoma, a modified version of Sangoma's example C program for data capture, and a set of Perl programs to control the acquisition and analyze the acquired data.
Sangoma's driver software was set up for CHDLC (Cisco HDLC) mode. The packet capture program, frpcap, writes files in a format closely modeled after the tcpdump format. The only significant difference is that the Frame Relay header is recorded in place of the Ethernet header. The first 150 bytes of each raw packet are usually saved to provide context information during application analysis.
The packet acquisition process is driven by frcap_run, a Perl script that runs every fifteen minutes. Frcap_run stops the current frpcap processes (one for each data direction) and immediately starts another pair. A traffic summary program, fr_decode, is then run on the two packet files. Following the summarization the raw packet files are compressed, and any files that are older than a preset age are deleted to conserve disk space. For a fairly busy set of Frame Relay circuits on a T-1 access line, eight days worth of raw packet files consumes 3-6GB of disk space.
The fifteen-minute raw packet files are summarized by a Perl program that appends its output to a daily summary file in XML format. The XML file is read by other programs for display and further analysis. An example of a fifteen-minute summary output displayed by a Web application that formats the XML data is shown in Figure 2. To reduce the size of Figure 2, data for a minor PVC were removed and only the top five numbers, rather than our usual ten, are shown in each category.
Frame Relay Traffic Summary (Philadelphia)
Out-Bound from Philadelphia Data
Capture Time: Thu Feb 10 11:00:00 2000 - Thu Feb 10 11:15:01 2000 GMT

PVC Summary (Out-Bound from Philadelphia)
 DLCI   Packets       Bytes    %    FECNs       BECNs       DEs DE  No DE
  460   79,648   12,422,725  30.2 %   0  0.0 %    0  0.0 %   0   0    328  London
  490  119,404   28,677,448  69.8 %   0  0.0 %    0  0.0 %   0   0  1,321  Paris
  All  199,052   41,100,173

Protocol Counts (Out-Bound from Philadelphia)
DLCI   Protocol           Packets        Bytes  % of PVC     TCP ReTransmits
460 London
       0800 06 IP TCP      40,291    9,068,685  ( 73.0%)       328 (  0.8%)
       8137    IPX         34,675    2,805,741  ( 22.6%)
       0800 11 IP UDP       1,671      316,118  (  2.5%)
       0800 01 IP ICMP      2,593      197,600  (  1.6%)
       809b    ATALK          203       15,000  (  0.1%)
       0800 58 IP IGRP        200       14,616  (  0.1%)
490 Paris
       0800 06 IP TCP      70,203   21,871,361  ( 76.3%)      1321 (  1.9%)
       8137    IPX         46,048    6,228,881  ( 21.7%)
       0800 11 IP UDP       2,051      498,644  (  1.7%)
       0800 01 IP ICMP        882       58,936  (  0.2%)
       0800 58 IP IGRP        205       14,886  (  0.1%)

Access Line Busiest Seconds (Out-Bound from Philadelphia)
      Time          Bytes        kbps
    11:08:11      125,513      1,004.1
    11:08:09      118,855        950.8
    11:08:13      116,336        930.7
    11:02:53      108,926        871.4
    11:08:14      104,754        838.0

PVC Busiest Seconds (Out-Bound from Philadelphia)
460 London
    11:02:53       77,873        623.0
    11:02:52       76,221        609.8
    11:02:54       47,667        381.3
    11:02:56       46,748        374.0
    11:00:07       44,487        355.9
490 Paris
    11:08:11      112,854        902.8
    11:08:13      105,761        846.1
    11:08:09       95,425        763.4
    11:08:14       92,765        742.1
    11:08:10       85,951        687.6
Access Line Quiet Seconds (Out-Bound from Philadelphia)
    11:12:53       11,366         90.9
    11:12:52       14,118        112.9
    11:12:54       15,371        123.0
    11:12:55       22,993        183.9
    11:11:48       23,544        188.4

PVC Quiet Seconds (Out-Bound from Philadelphia)
460 London
    11:05:14        3,640         29.1
    11:04:55        3,859         30.9
    11:05:33        4,068         32.5
    11:07:48        4,118         32.9
    11:06:20        4,170         33.4

490 Paris
    11:12:53        3,460         27.7
    11:12:54        6,613         52.9
    11:12:52        8,187         65.5
    11:13:18       14,021        112.2
    11:12:55       14,065        112.5

Top Sources (Out-Bound from Philadelphia)
                                    Bytes  % of Total
   1 TCP 155.94.114.164  1867    4,673,580  11.0   Philadelphia GroupWise
   2 TCP 10.2.71.201     1494    2,644,817   6.2
   3 TCP 155.94.155.23   1521    1,671,696   3.9   ra01u04 - Philadelphia DCG
   4 TCP 192.233.80.5    80      1,272,224   3.0
   5 TCP 209.58.93.100   1494      931,341   2.2   MARTE WinFrame 1

Top Destinations (Out-Bound from Philadelphia)
                                    Bytes  % of Total
   1 TCP 10.248.107.217  7100    4,742,966  11.2
   2 TCP 10.247.113.201  4498    1,272,224   3.0
   3 IPX 0451 01000105 1         1,138,074   2.7   NCP
   4 TCP 10.248.89.1     7100      952,921   2.2
   5 TCP 10.247.66.76    1073      931,341   2.2

Application Summary (All PVCs, Out-Bound from Philadelphia)
                              New TCP    Total TCP
 Application                 Sessions     Sessions      Packets        Bytes
 Internet TCP                   4,684        4,817       41,455    13,128,752
 IPX                                                     90,631     9,785,697
 Unknown TCP                    1,016        1,167       41,305     7,141,942
 GroupWise TCP                     98          138       12,106     6,722,084
 DCG TCP                          138          150        7,370     1,824,223
 MARTE WinFrame TCP                 2            5        4,428     1,041,713
 IP Protocol  0b NVP-II                                   3,894       839,902
 EDMS TCP                          13           20        3,075       775,923
 MARTE Oracle TCP                   1            3        1,882       472,541
 MLIMS TCP                         38           22          850       255,473
 Internet ICMP                                            3,255       214,690
 Unknown ICMP                                               780        78,666
 ProbMan TCP                        0            4          181        48,826
 IP Protocol 3a IPv6-ICMP                                   598        43,012
 Unknown ATALK                                              203        15,000
 ASTROS TCP                         2            6           62         9,963

TCP SYNs (connection requests): 5996         Total TCP Re-Transmissions: 1662
The report consists of five major sections. The first section is a PVC summary showing the DLCI (circuit number), number of packets and bytes, percentage of bytes per circuit relative to all circuits on the access line, congestion notification counts, DE (discard eligible) counts and TCP re-transmission counts. Since this router does not set any congestion notification information (Frame Relay switches further down stream set these) or DE bits, the counts are all zero for the out-bound direction. Some of our routers do set DE for Internet traffic to give it a lower priority (setting DE tells the carrier that the traffic can be dropped if the network is congested, in exchange the carrier does not count the packets towards certain credit limits). The TCP re-transmit counts are done separately for packets with and without DE so that we can determine the effect on packet loss within the Frame Relay network when DE is set.
Layer 2 and 3 protocol counts are summarized in the second section. For each protocol observed the Ethernet/802.2 type field, IP type by number (if an IP protocol), protocol name, number of packets and bytes, and percent utilization by bytes for the PVC are shown. For TCP/IP a count of packet re-transmissions is displayed.
In the third section we display the busiest and quietest seconds for the access line and for each PVC. The generation and use of these data are described later under Congestion and Circuit Capacity Planning.
The top sources and destinations of data are shown in the fourth section. The protocol, IP address, port number, number of bytes, and percentage of the total for all traffic on the access line are included. If the server name is known it is also displayed, along with a short description of the application.
The fifth section of the report lists the utilization of the access line by application. Where possible we identify applications by the IP address of the server. Although it might make sense to further define applications by port number, many of our servers run a single application. In fact we often have two servers running the same application in which case packets with either IP address will count towards the application. Database servers often run multiple applications which all use the same IP address/port number pair so the addition of a port number qualification would still not uniquely identify all applications. In the future we hope to encourage the use of virtual IP addresses assigned on a per application basis to provide a simple accounting method. The ``New TCP Sessions'' column indicates how many sessions were initiated during the fifteen-minute period and ``Total TCP Sessions'' counts both new and ongoing sessions. For Web based applications these counts are not very useful except as a type of hit counter, but for applications with persistent connections it is a measure of the number of users connected during the period.
The final two items in the report are a count of initial TCP SYNs, which might be used for intrusion detection, and a count of TCP re-transmissions for all PVCs.
Figure 3 shows the top of a report for the in bound direction. Note that we have a variety of FECN, BECN, and DE information related to packets flowing in this direction. The FECNs and BECNs provide information on the level of congestion in the carrier's Frame Relay network [Blac95]. The rest of the report contains the same information as shown in Figure 2.
In-Bound to Philadelphia Data
Capture Time: Thu Feb 10 11:00:00 2000 - Thu Feb 10 11:15:01 2000 GMT
PVC Summary (In-Bound to Philadelphia)

DLCI  Packets      Bytes    %    FECNs         BECNs          DEs DE No DE
 460  62,915   6,453,502  36.9 %  515  0.8 %     31  0.0 % 2,211   6  111 London
 490 109,900  11,024,584  63.1 %   39  0.0 % 11,800 10.7 %     0   0  656 Paris
 All 172,815  17,478,086
Several customizable reports using the fifteen-minute summary data are available. A Web form can be used to select a single application and then generate a list of ``Application Summary'' entries for just that application. This list of application usage is very helpful for determining the bandwidth impact of an application and the number of users. Since we are often told, ``There will be 400 users in Europe accessing this Philadelphia based application'', we can use the tool to judge how many are logged-in simultaneously and to monitor usage growth. Another program will generate a daily or monthly ``Application Summary'' by summing usage for each application over time.
The above example data is for one of our busier access lines, but it is far from the most complex. One European Frame Relay hub site has 13 PVCs on a single access line. Some of the traffic is business critical telnet traffic between subsidiary sites and an AS/400 at the hub site. Much of the traffic, however, is intranet mail or Internet data that comes in on one PVC and then heads towards the US on another PVC. Without the Frame Relay monitor it would be very difficult to determine what applications and protocols consume the PVC and access line bandwidth. In some cases it is necessary to obtain application summaries for a single PVC to determine what is happening on a particular circuit. We do not routinely report application and protocol usage on a per PVC basis in order to keep the size and complexity of the reports reasonable.
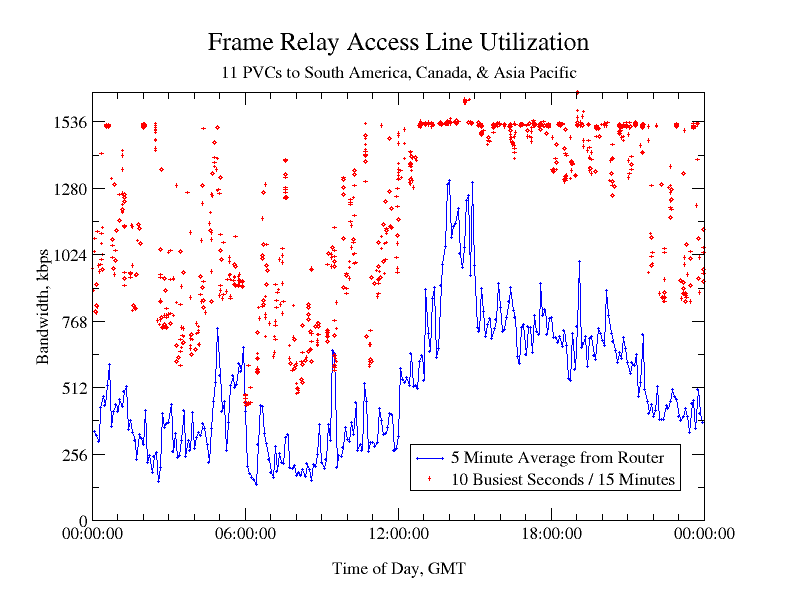
Like many organizations, we collect router statistics via SNMP every five minutes. While five-minute averages are a useful measure of how a circuit is doing in relationship to its bandwidth limit, they do not tell a lot about the instantaneous (one second, or smaller, time scale) state of a circuit that governs interactive performance. If a circuit is saturated for several ten-second bursts during a single five-minute period the average utilization might appear to be quite reasonable. An interactive user, however, would likely say that the network was slow while his packets were waiting in a router buffer.
Our monitor attempts to measure the largest peaks in a fifteen-minute period by summing the number of bytes transmitted and received for each one-second interval. The summary program reports the ten busiest seconds for the access line and each circuit. A sample plot of busy seconds for one day is shown in red in Figure 4. Time periods with a wide range of values are good because they indicate a large variation in the top ten busy seconds and therefore there are fewer than ten very congested seconds in a fifteen-minute period. The lack of busy seconds below the full speed of the T-1 (1536 kbps) starting at 12:45 GMT indicates significant on-going congestion. There are several busy seconds above the 1536 kbps line. These are probably due to packets being held in buffers. We hope to reduce the delays in servicing interrupts by prioritizing the data acquisition process. Quiet seconds are measured in a similar fashion. If a usually busy circuit has seconds with zero, or a low number of bytes, then it may indicate a circuit or routing problem.
We had one problem where a large number of quiet seconds were showing up with low utilization during busy times of the day. Since there were also user complaints, a detailed analysis of the packet data was performed. It showed all IP traffic periodically stopping for about eight seconds while IPX was still flowing normally. We traced the root cause to an IP routing problem. Without the IPX traffic the problem would have been easy to spot since there would have been periods of about eight seconds with zero traffic on an otherwise busy circuit.
While we have not yet developed a formal rule set, it should be possible to determine how well PVCs and access lines are sized with respect to the actual traffic using busy second data. Clearly, looking at the busiest seconds on a circuit is much more meaningful than five-minute average data when mission critical interactive applications are the most important traffic.
Since the raw packet data are stored in separate files for in-bound and out-bound directions the two files must be combined for traditional packet trace analysis. A utility program performs this task by putting the packets from a pair of files into a time ordered sequence and writing a tcpdump format file. A ``Frame Relay information'' file containing the Frame Relay header information is also written.
We have a packet trace analysis program originally written for tcpdump files that can optionally read the ``Frame Relay information'' file and list the DLCI (circuit ID), FECN, BECN, and DE bits for each packet. Using this feature, we have discovered that some applications were operating over asymmetric routes. In addition to our own analysis programs, the tcpdump format files can be examined using other programs such as tcpdump itself, or ethereal [Ether00]. Since ethereal, and its companion program editcap, can export packet data to other formats, the traces can be analyzed with popular commercial products. When a session needs to be followed through multiple fifteen-minute periods we use a simple program to concatenate multiple tcpdump files.
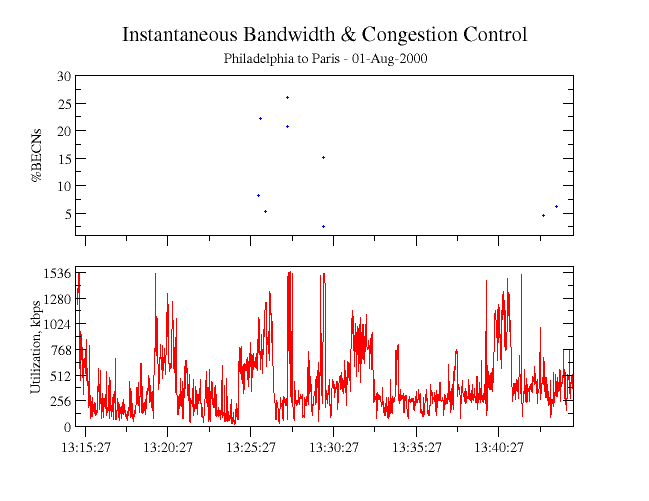
In a previous paper [Meek98] we discussed interesting issues we have had with our telecommunications vendors. Our complaints about a slow circuit sometimes yield a vendor response like: ``Customer is exceeding CIR by 160%'' with the implication that the over utilization of a circuit (bursting) has lasted for an excessively long period. With raw packet information it should be possible to compute bandwidth utilization on a per-second basis and use the same algorithm as the telecommunications equipment to verify when, and by how much, CIR was exceeded. Figure 6 shows the per-second bandwidth utilization of a circuit for a thirty-minute period and the percentage of in-bound packets with the BECN bit set to indicate congestion on the out-bound circuit. The BECNs are sent by the carrier's switches to indicate that there is congestion in our out-bound direction and that our bandwidth usage will be throttled if we are exceeding CIR and are out of credits. In the future we hope to use this data to accurately determine when we truly exceed our contracted bandwidth and how we might implement quality of service to prioritize traffic to manage bandwidth bursts.
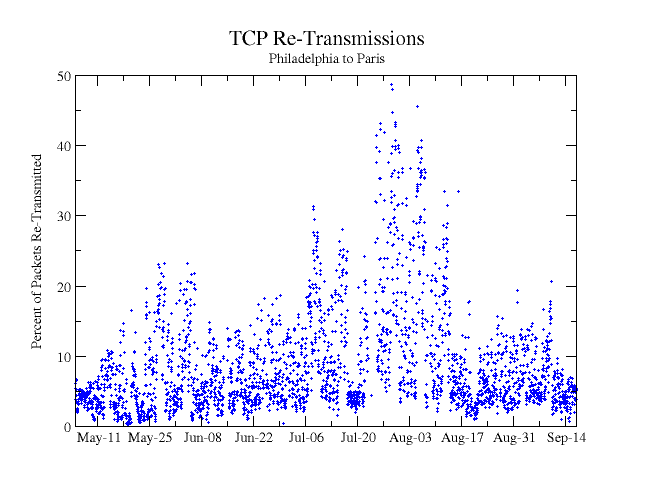
Packet loss is an important parameter in any data network. One measure of packet loss is the percentage of TCP packets that must be re-transmitted. Figure 7. illustrates TCP re-transmission rates on one of our busy circuits over several months. Hours with fewer than 10,000 TCP packets are not shown. Since this circuit feeds multiple downstream Frame Relay circuits, and many LAN segments, packet loss could occur in several places. During late July we had problems with a T-1 interface that caused a significant portion of the re-transmissions during that period. Further analysis of the raw packet data can determine what destination IP addresses were responsible for the re-transmissions. We recently added a new section to the standard report (Figure 2) that lists the top ten destinations of re-transmitted packets to help identify hosts or subnets with problems. Re-transmitted packets are counted by tracking the TCP sequence numbers by session for packets with a payload (not acknowledgment-only packets).
Profiling the bandwidth requirements of an application is a useful exercise to perform during the development or evaluation of a software product. We have often found that applications originally developed for use on a LAN have serious problems when they are moved to a WAN or Internet environment. Problems result from large quantities of data being sent, application level handshaking resulting in excessive round-trip-time waiting, or even the same set of data being requested (and delivered) multiple times due to a programming error. These issues have occurred in both internally developed and purchased commercial software.
One advantage to using the WAN packet capture system for application profiling is that the application under test can be observed along with all of the other data flowing on the circuit at the same time. Since we routinely capture all of the traffic on monitored circuits, no advance preparation is required for most application profiling tests. We have found, however, that it is helpful when testing an interactive application if the test procedure has timed pauses of 15 to 30 seconds where the user does not touch their hardware. The pauses are used to separate phases of the application in the packet traces and to determine if the client and server ``chatter'' when idle.
A disadvantage to using the WAN packet capture system for these tests is that we generally capture only 150 bytes of combined header and payload. While this small number of payload bytes is often enough to determine the context of the application (especially when ASCII or EBCDIC data are involved), it might not be enough to confidently determine that multiple packets with identical payload are being transmitted within a session (determined by computing MD5 checksums on payload content [Meek98]).
Two examples of application profiling are summarized graphically in Figures 8 and 9. The application profiled in Figure 8 is a widely used ERP (Enterprise Resource Management) system that uses page-based terminals as the user interface. The user interacts with the system by filling out text forms and then transmitting the screen page to the server. This method, similar to modern Web applications, is an efficient way to implement interactive applications on a WAN since reasonable size chunks of data, in comparison to keystrokes, are transmitted at one time.
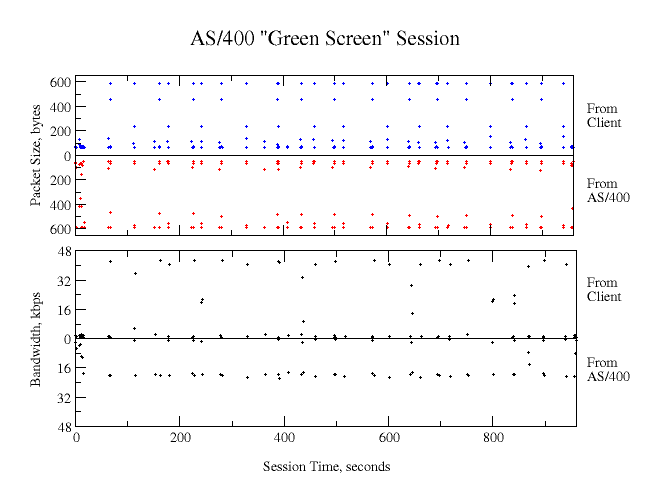
To determine how much bandwidth a single user consumes we look at the packets for individual sessions as a function of time. The top plot shows the distribution of packet sizes for each direction, while the bottom plot shows the bandwidth used per second. A detailed look at the numbers shows that 143,473 bytes in 400 packets were sent from client to server and 112,560 bytes in 348 packets were sent from server to the client. By closely inspecting the data using an interactive data analysis tool [Grace00] we find that a typical transaction is completed in one or two seconds. The maximum bandwidth used was 43kbps from client to server and 22kbps in the other direction.
The packet data in this analysis were extracted from 30 minutes of raw packet capture data from a Frame Relay access circuit with 13 PVCs. The first step was to combine in-bound and out-bound packet streams into single tcpdump format files. The tcpdump files for the two 15-minute time periods required to span the session were then concatenated. Finally, the combined file was processed with tcpdump acting as a pre-filter to select the session of interest and feed it to our own software that summarized the session and prepared the packet and bandwidth data for plotting.
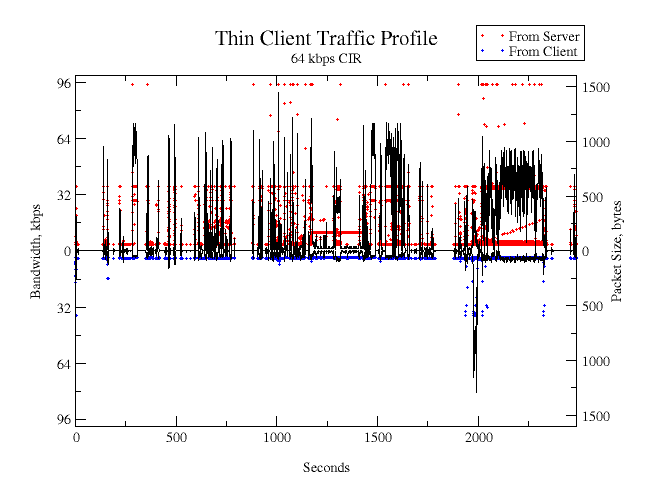
The profile in Figure 9 is from a PC-to-server ``thin client''. The actual application runs on a server and is displayed on the client, much like X Windows, but using a more efficient protocol. Traffic between the client and server consists of keyboard and mouse data, screen refreshes, and, in some cases, file transfer. In this example a file transfer was started at about 2100 seconds into the session.
Tools presented here do a complete job of quantifying the actual bandwidth used by an application on a one-second time scale and demonstrating fundamental differences in the bandwidth requirements for different applications (``burstiness'', bandwidth use evenly divided between the two directions, or not). The tools, do not, however, address simulated scaling of the application. Presumably, our data could be used as input to a network simulation tool to perform the scaling simulation to multiple users. Our tools can, however, select any slice of actual recorded network traffic based on source, destination, port number, etc. and determine the total bandwidth utilization for the applications encompassed by the slice. In addition, it is important to consider the effect of network latency on the application. [Meek98]
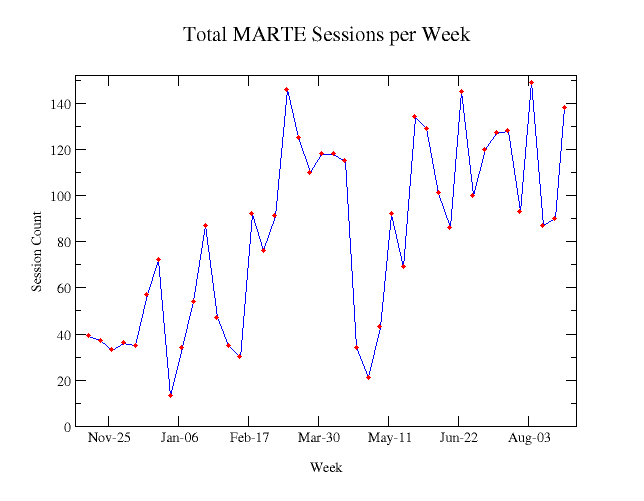
In order to determine how the use of an application changes over time we can look at some parameter representing usage. In Figure 10 we show the number of sessions per week for one application. The use of this particular application varies depending on business cycles and holiday schedules. Other parameters useful as a measure of application usage are bytes transferred or number of packets. Bytes or packets are especially useful for Web, or other non-session oriented applications.
We were pleasantly surprised to discover that the hardware and software can be used without modification on T-1 point-to-point circuits. The packets on the point-to-point circuits have a header very similar to a Frame Relay header. The first two bytes of the Frame Relay header contain packed data representing the DLCI number and the FECN, BECN, and DE bits. [Blac95] The first byte of a point-to-point serial line packet is set to 0x0F for unicast packets and 0x8F for ``broadcast packets'' and the second byte is always zero. [Cisc00] For both Frame Relay and point-to-point serial the third byte contains the Ethernet protocol code. Note that these conventions may be specific to certain types of equipment.
When all traffic of interest is accessible from the LAN, simpler tools and techniques should be used to record traffic. We use a simple script to start tcpdump and rotate the packet capture files on a time schedule controlled by cron (the user-mode command scheduler). The acquired data can be analyzed using the methods described here for WAN traffic.
Because we are now moving some of our major circuits to ATM in order to overcome T-1/E-1 and Frame Relay bandwidth limitations we hope to be able to extend the techniques discussed here to ATM. This should be straightforward if the ATM interface card performs the re-assembly of ATM cells into complete IP packets. The design and implementation of an ATM monitor is discussed in [Api96].
Some of the parameters measured by the system will probably be used to generate alarms when they exceed certain thresholds. The TCP re-transmission rate and quiet/busy seconds are likely candidates for alarms. Frame Relay provides information about circuits using LMI (Local Management Interface) packets. Currently we do not decode these, but plan to add the capability in the future.
We would like to measure the effectiveness of QoS (Quality-of-Service) schemes by measuring packet delays through the router for packets in different classes of service. This would likely be done using tcpdump on the Ethernet side and WAN packet capture on the serial line side of the router. Histograms of packet delays during busy periods should show that the high-priority traffic passes through the router more quickly than lower priority traffic. The results might be used to tune QoS parameters.
We have assembled a low cost Frame Relay and T-1 packet capture system with a large memory and applied it to real problems. The use of this monitor is helping us communicate to management how the WAN is being used at the application level. It also provides detailed worst-case traffic information through the analysis of busy and quiet seconds. We have upgraded bandwidth on some circuits following analysis of peak utilization data, identified unusual routing problems, and profiled the network impact of applications. The large memory and long retention time for the raw packet data allow us to troubleshoot many network problems days after they occurred, an important factor in our large, global organization. The data analysis discussed in this paper just touches on possible uses of raw packet data from WAN circuits. In the future, we expect to mine the information in new ways.
Supplemental information and some of the software used in the work described here can be obtained at http://wanpcap.sourceforge.net.
The author would like to acknowledge Jim Trocki, Kevin Carroll, Kim Takayama, Jim French, and the technical staff at Sangoma Technologies Inc. for valuable discussions, advice, and information during the development of the tools. Drafts of this paper were expertly reviewed by Bill Brooks, Kevin Carroll, Edwin Eichert, and William LeFebvre.
[Blac95] Uyless Black, Frame Relay Networks: Specifications and Implementations, McGraw-Hill 1995.
[Cisc00] Cisco Systems, WAN Group, private communication.
[Ether00] Ethereal, A network protocol analyzer, http://ethereal.zing.org/, 2000.
[Grace00] ``Grace, a WYSIWYG 2D plotting tool for the X Window System and M*tif'', http://plasma-gate.weizmann.ac.il/Grace/, 2000.
[McCa97] Steve McCanne, Craig Leres, Van Jacobson, ``TCPDUMP 3.4'', Lawrence Berkeley National Laboratory Network Research Group, 1997.
[Meek98] Jon T. Meek, Edwin S. Eichert, Kim Takayama, ``Wide Area Network Ecology,'' Proceedings of the Twelfth Systems Administration Conference (LISA '98), USENIX, Boston, 1998.
[Ranu97] Marcus J. Ranum, Kent Landfield, Mike Stolarchuk, Mark Sienkiewicz, Andrew Lambeth, and Eric Wall. ``Implementing a Generalized Tool for Network Monitoring,'' 11th Systems Administration Conference (LISA), 1997.